Your CV is your professional story, a detailed account of your skills, experiences, and the unique value you bring as a Data Visualization Developer. It's about striking a balance between showcasing your technical data visualization abilities and your strategic impact on business insights. Writing an impactful CV means emphasizing the aspects of your career that highlight your analytical expertise and demonstrate why you're the ideal fit for data visualization roles.
Whether you're aiming for a role in business intelligence, data science, or data analysis, these guidelines will help ensure your CV stands out to employers.
Highlight Your Certification and Specialization: Specify qualifications like Certified Data Management Professional (CDMP), Certified Business Intelligence Professional (CBIP), or Certified Analytics Professional (CAP). Detail specializations such as business intelligence, data mining, or predictive modeling early on in your CV.
Quantify Your Impact: Share achievements with numbers, like a 30% improvement in data accuracy or a 20% increase in business insights from your visualizations.
Tailor Your CV to the Job Description: Match your CV content to the job's needs, highlighting relevant experiences like data modeling or machine learning if emphasized by the employer.
Detail Your Tech Proficiency: List proficiency in software like Tableau, Power BI, or D3.js, and any experience with programming languages like Python or R. These matter.
Showcase Soft Skills and Leadership: Briefly mention leadership, teamwork, or your knack for explaining complex data in simple, visual terms.
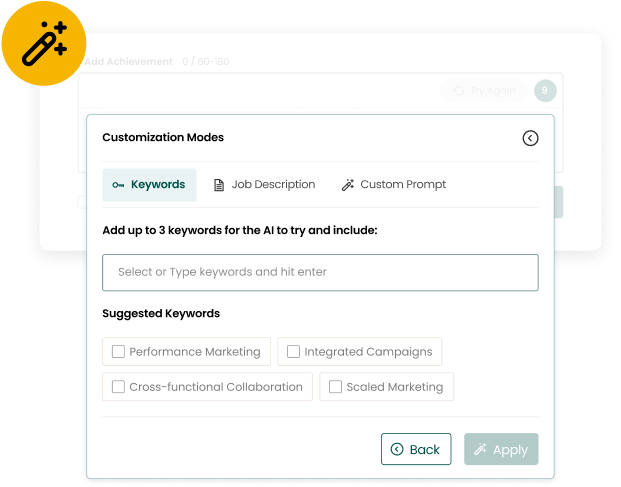
The Smarter, Faster Way to Write Your CV
Craft your summaries and achievements more strategically in less than half the time.
Highly skilled Data Visualization Developer with extensive experience in creating innovative data visualization strategies that enhance decision-making and operational efficiency. Proven track record in leading teams to successfully complete major projects, implementing cutting-edge tools, and fostering a data-driven culture. With a knack for translating complex data into actionable insights, I am committed to driving productivity and business performance through effective data visualization.
CAREER Experience
Data Visualization Developer• 01/2024 – Present
Mega Motors
Developed and implemented a new data visualization strategy that improved the company's decision-making process, leading to a 30% increase in operational efficiency.
Managed a team of 4 data visualization developers, successfully completing 10+ major projects within the stipulated deadlines and under budget.
Introduced an innovative data visualization tool that enhanced the understanding of complex data sets, resulting in a 20% increase in productivity across all departments.
Business Intelligence Analyst• 03/2023 – 12/2023
DataGrid Networks
Designed and developed an interactive dashboard that provided real-time insights into business performance, leading to a 15% increase in sales.
Collaborated with cross-functional teams to gather requirements and translate them into effective data visualizations, improving communication and understanding between departments.
Conducted regular training sessions on data visualization best practices, increasing the team's proficiency and output by 25%.
Data Analyst• 11/2021 – 03/2023
ByteGrid Networks
Implemented a data visualization solution that streamlined the analysis of large data sets, reducing the time spent on data processing by 40%.
Played a key role in the development of a data-driven culture within the organization, leading to more informed and effective decision-making processes.
Successfully managed the migration of legacy data visualization tools to modern platforms, improving data accessibility and reducing maintenance costs by 30%.
SKILLS
Data Visualization Strategy Development
Team Management and Leadership
Project Management
Interactive Dashboard Design and Development
Cross-Functional Collaboration
Data Visualization Training and Mentoring
Data Analysis and Processing
Development of Data-Driven Culture
Data Migration and Modernization
Complex Data Set Interpretation
EDUCATION
Bachelor of Science in Data Science
University of New Hampshire
2016-2020
Durham, NH
CERTIFICATIONS
Tableau Desktop Certified Professional
04/2024
Tableau
Certified Business Intelligence Professional (CBIP)
04/2023
Transforming Data with Intelligence (TDWI)
Microsoft Certified: Azure Data Engineer Associate
04/2023
Microsoft
Data Visualization Developer CV Template
1.) Contact Information
Full Name
[email protected] • (XXX) XXX-XXXX • linkedin.com/in/your-name • City, State
2.) Personal Statement
Innovative Data Visualization Developer with [number of years] years of experience in [specific data visualization tools/technologies]. Seeking to leverage my expertise in [specific skills, e.g., data modeling, interactive dashboard creation] to drive [specific outcomes, e.g., data-driven decision making, business intelligence] at [Company Name]. Committed to transforming complex data into intuitive, impactful visualizations that enhance understanding and strategic planning.
3.) CV Experience
Current or Most Recent Title
Job Title • State Date • End Date
Company Name
Collaborated with [teams/departments] to develop [type of visualization, e.g., interactive dashboards, data reports], demonstrating strong [soft skill, e.g., teamwork, communication].
Managed [data-related task, e.g., data cleaning, data integration], utilizing [tool or software, e.g., Tableau, Power BI] to improve [operational outcome, e.g., data quality, reporting efficiency].
Implemented [system or process improvement, e.g., new visualization techniques, data management practices], resulting in [quantifiable benefit, e.g., 20% increase in data accuracy, 30% faster report generation].
Previous Job Title
Job Title • State Date • End Date
Company Name
Played a pivotal role in [project or initiative, e.g., business intelligence project, data analysis campaign], which led to [measurable impact, e.g., improved decision-making, increased business insights].
Conducted [type of analysis, e.g., trend analysis, predictive modeling], using [analytical tools/methods] to inform [decision-making/action, e.g., business strategies, product development].
Key contributor to [task or responsibility, e.g., data quality assurance, visualization design], ensuring [quality or standard, e.g., data integrity, visual appeal] across all data visualizations.
4.) CV Skills
Data Visualization Strategy Development
Team Management and Leadership
Project Management
Interactive Dashboard Design and Development
Cross-Functional Collaboration
Data Visualization Training and Mentoring
Data Analysis and Processing
Development of Data-Driven Culture
Data Migration and Modernization
Complex Data Set Interpretation
5.) Education
Official Degree Name
University Name
City, State • State Date • End Date
Major: Name of Major
Minor: Name of Minor
6.) Certifications
Official Certification Name
Certification Provider • State Date • End Date
Official Certification Name
Certification Provider • State Date • End Date
100+ Free Resume Templates
Accelerate your next application with a free resume template. Create a polished resume in under 5 minutes.
In the field of data visualization, the formatting of your CV can significantly impact your job search success. Proper formatting not only showcases your attention to detail—a crucial skill for data visualization developers—but also makes your CV easier to read and more appealing to potential employers. A well-structured CV reflects your professional attributes and can be the deciding factor in securing an interview.
Start with a Clear Objective
Begin your CV with a clear, concise objective that aligns with the data visualization developer role you’re applying for. This should succinctly state your career goals and how you plan to contribute to the prospective company. Highlighting your enthusiasm for the profession and your readiness to grow within it sets a positive tone for the rest of your CV.
Highlight Education and Relevant Projects
For data visualization developers, your educational background and any relevant projects take precedence. Format this section to list your degree, any data visualization courses, and projects at the top, as they are your primary qualifications. This layout helps hiring managers quickly verify your data visualization fundamentals and practical knowledge.
Detail Relevant Experience and Skills
Detailing your experience in data visualization, including internships, part-time jobs, or volunteer work where you utilized data visualization skills is vital. Use bullet points to describe responsibilities and achievements, focusing on tasks that demonstrate your analytical skills, proficiency with data visualization tools, and any experience with data analysis or reporting.
Emphasize Technical Proficiencies
Technical skills are crucial for data visualization developers. Include a section that highlights your proficiency in data visualization tools (e.g., Tableau, PowerBI, D3.js) and programming languages (e.g., Python, R). This shows you’re not only capable of creating compelling visualizations but also of handling the data processing and analysis that underpins them.
Showcase Your Portfolio
As a data visualization developer, your portfolio is a powerful tool to showcase your skills and creativity. Include a link to your portfolio in your CV. Ensure that it is easily accessible and contains your best work. This gives potential employers a direct view of what you can deliver, making your CV stand out.
Personal Statements for Data Visualization Developers
Data Visualization Developer Personal Statement Examples
Strong Statement
"Highly skilled Data Visualization Developer with over 6 years of experience in creating intuitive and impactful visualizations for complex data sets. Proven ability to translate business requirements into interactive dashboards and reports using advanced tools like Tableau and Power BI. Passionate about leveraging data to drive strategic decision-making and improve business performance. Eager to bring my expertise in data analysis and visualization to a dynamic team."
Weak Statement
"Dynamic Data Visualization Developer specializing in transforming complex data into actionable insights through compelling visualizations. With a strong foundation in both data analysis and design principles, I excel at creating user-friendly dashboards that facilitate data-driven decision making. Eager to contribute to a forward-thinking company by providing expert data visualization solutions and robust analytical insights."
Strong Statement
"Dynamic Data Visualization Developer specializing in transforming complex data into actionable insights through compelling visualizations. With a strong foundation in both data analysis and design principles, I excel at creating user-friendly dashboards that facilitate data-driven decision making. Eager to contribute to a forward-thinking company by providing expert data visualization solutions and robust analytical insights."
Weak Statement
"Experienced in various data visualization tasks, including creating dashboards and reports. Familiar with data analysis and design principles. Looking for a role where I can use my data visualization skills and improve data-driven decision making."
What Makes a Strong Personal Statement?
A strong personal statement for a Data Visualization Developer CV seamlessly blends professional achievements with specific data visualization skills, clearly demonstrating the candidate's value through measurable outcomes. It stands out by being highly tailored to the data visualization field, highlighting expertise in areas like data analysis, design principles, and strategic decision making, directly addressing how these skills meet the needs of the prospective employer.
Compare Your CV to a Job Description
Use Matching Mode to analyze and compare your CV content to a specific job, before you apply.
How long should Data Visualization Developers make a CV?
The ideal length for a Data Visualization Developer's CV is 1-2 pages. This allows sufficient room to showcase your technical skills, project experience, and proficiency in data visualization tools. Prioritize detailing your most impactful data visualization projects and achievements that align with the role you're applying for. Remember, clarity and relevance are key - your CV should quickly convey your expertise and value to potential employers.
What's the best format for an Data Visualization Developer CV?
The best format for a Data Visualization Developer CV is a combination format. This highlights both your skills and work experience, emphasizing your proficiency in data analysis, software usage, and visual design. Start with a skills summary, showcasing your technical abilities and creativity. Follow with a reverse-chronological work history, highlighting projects where you've applied these skills. Tailor each section to the job requirements, focusing on your data visualization achievements and competencies.
How does a Data Visualization Developer CV differ from a resume?
To make your Data Visualization Developer CV stand out, highlight your proficiency in relevant software like Tableau, PowerBI, or D3.js. Showcase your ability to translate complex data into understandable visuals by including portfolio links or project descriptions. Emphasize any unique experience in data analysis or machine learning. Tailor your CV to each job, using keywords from the job description, and quantify your achievements to demonstrate your impact.